The 90-Day Blind Spot
Losing one AE doesn’t just remove a headcount number from a spreadsheet, it sets your capacity back an entire quarter or more. By the time you detect the gap, open the role, hire a replacement, and wait for them to reach full productivity, you’ve already absorbed 90 to 180 days of reduced capacity. The revenue impact is measurable. The early warning signs rarely are.
Capacity planning should be straightforward: calculate how many reps you need to hit revenue targets, track who's ramping and who's producing, and adjust when things change. But for most revenue teams, it's anything but simple.
One unplanned departure removes a full AE’s worth of productivity for nearly a year — long before the impact appears in pipeline or forecast.
Why Traditional Capacity Planning Breaks Down
The issue isn’t the lack of planning; it’s the lack of shared logic.
Sales works from headcount and quota assumptions in spreadsheets.
Finance models revenue independently, using ramp curves that aren’t grounded in reality.
HR tracks requisitions without visibility into the capacity impact of delayed hires.
The result? Three teams, three versions of the truth, and no one able to answer the most critical question: How long until we're back to 100% capacity?
The 7 Most Costly Capacity Planning Pitfalls
1. Confusing Headcount with Capacity
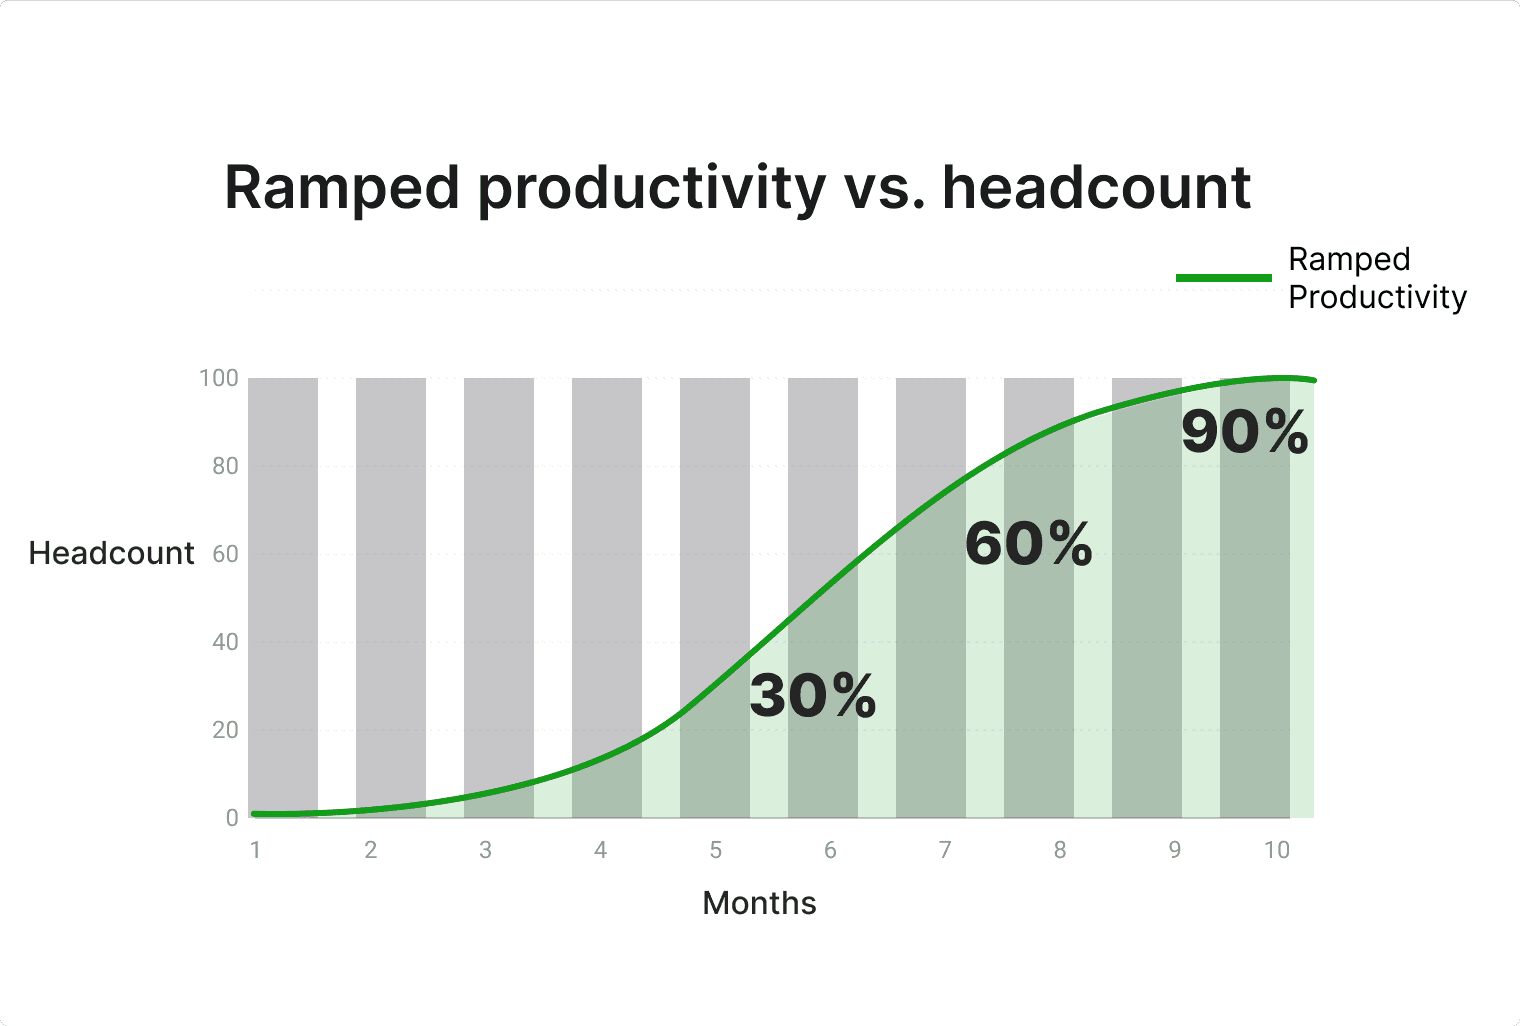
Most teams plan to headcount, not ramped productivity.
A team of 100 AEs looks strong on paper, until you recognize that 24 of them are in their first 90 days and producing at only 30% of quota.
Your actual capacity isn’t 100 fully productive reps, it’s closer to 85 ramped rep equivalents.
The impact:
Forecasts miss by 15-20% because leadership assumes full productivity from day one. Revenue targets get set based on bodies in seats, not actual selling capacity.
The path forward:
Track ramped capacity in real-time by applying actual ramp curves to every rep based on their tenure. Model scenarios that account for time-to-hire and time-to-productivity; not just headcount targets.
Headcount inflates capacity unless you apply real ramp curves.
2. Ignoring Attrition Until It’s Too Late
Treating attrition as a point-in-time event rather than a continuous capacity drain.
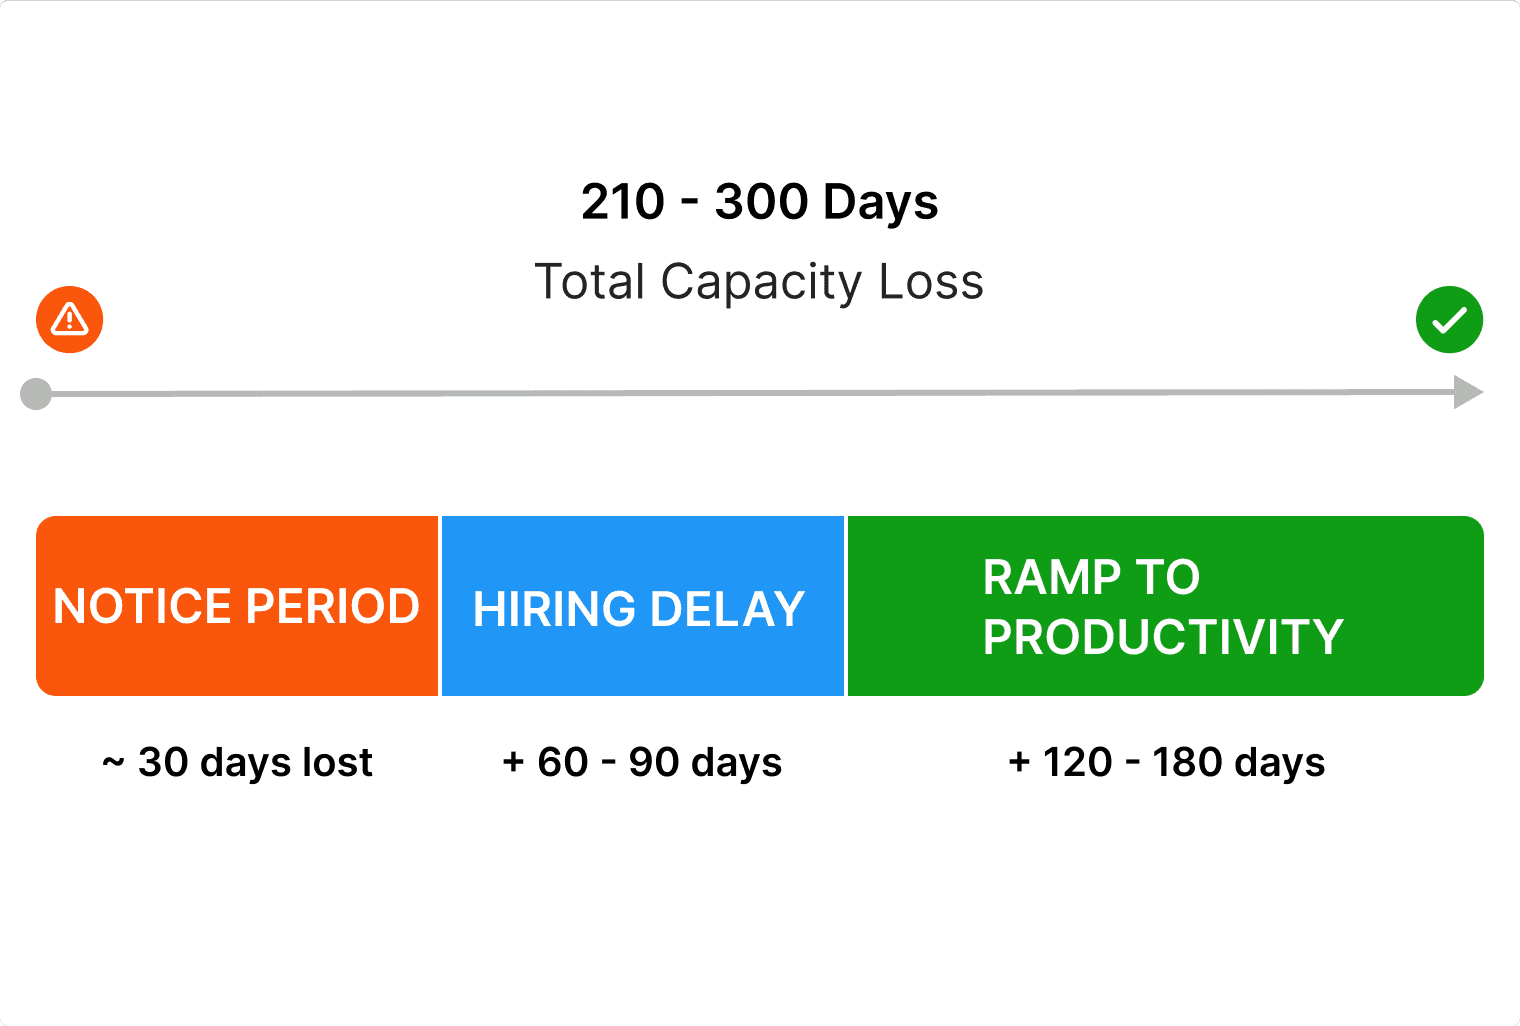
When a top performer gives notice, you've already lost 30 days of productivity (notice period), plus 60-90 days to hire a replacement, plus another 120-180 days for the new rep to ramp. That's 210-300 days of lost capacity from a single departure.
The impact:
One unplanned departure in Q2 can cost you $200K-$500K in lost revenue by year-end—but most teams don't quantify this until they're explaining a quarterly miss.
The path forward:
Use early-warning signals to detect risk. When someone leaves, calculate the exact recovery timeline immediately—time-to-hire + ramp—and adjust forecasts instantly.
3. Rebuilding Planning Logic Every Quarter
Most teams rebuild capacity planning from scratch each cycle: new spreadsheets, new formulas, new tabs. None of the prior quarter’s insights carry forward.
The impact:
Teams spend 40-60 hours per quarter on planning work that should take minutes. Forecast accuracy hovers around 70% because there's no continuous learning between cycles.
The path forward:
Use a living knowledge base: ramp curves, coverage models, hiring assumptions; that persists across quarters. Planning becomes continuous modeling rather than quarterly rebuilds.
4. Disconnected Data Across Systems
HRIS, ATS, and Salesforce weren’t built to talk to one another. Capacity planning ends up split across Workday, Greenhouse, dashboards, sheets, and Slack.
The impact:
Hours get wasted reconciling data instead of making decisions. Coverage gaps go undetected because no one can see the full picture.
The path forward:
Unify data from HRIS, ATS, Salesforce, and other systems into one continuous planning reality. When systems talk to each other, capacity changes trigger automatic recalculations of recovery timelines and revenue impact.
5. Underestimating Ramp Time Variance
Most organizations apply a single ramp curve across roles and segments.
Reality varies widely:
Enterprise AEs may take 6–9 months
Commercial reps often ramp in 3–4 months
SDRs may be productive in under 60 days
The impact:
New hires underperform expectations, but no one knows if it's a coaching issue or an unrealistic timeline. Capacity forecasts assume linear ramps when reality is stepwise and role-dependent.
The path forward:
Track actual ramp curves by role, segment, and cohort. Use historical data to set realistic productivity expectations at 30, 60, 90, and 180 days. Apply role-specific curves when modeling capacity changes.
Source: Sales wiki
6. Planning for Perfect Scenarios
Most models assume ideal timelines: hiring on schedule, zero attrition, and textbook productivity.
The impact:
The moment something slips—a delayed hire, unplanned leave, a poor fit—capacity projections break. Reality never matches the perfect-world plan.
The path forward:
Model multiple scenarios—best case, expected case, and risk case. Build capacity buffers for known variables like parental leave and historical attrition rates. Run "what-if" scenarios before problems emerge, not after.
Include historical variance, buffers, and risk cases as part of every planning cycle.
7. No Shared Accountability Across Revenue Teams
Capacity planning is treated as a functional responsibility, not a shared one.
Sales owns the quota.
Finance owns the forecast.
HR owns the hiring pipeline.
RevOps owns the model.
When gaps emerge, misalignment resurfaces instead of solutions.
The impact:
Pipeline, hiring, and forecast decisions diverge from one another.
Misalignment compounds. Finance forecasts revenue based on outdated headcount assumptions. HR prioritizes the wrong roles because they don't see the capacity impact. Sales makes coverage decisions without knowing when backfills will actually ramp.
The path forward:
Create shared visibility where sales, finance, and HR work from the same source of truth. Capacity changes, attrition, new hires, ramp progress—trigger updates that everyone sees in real-time. Accountability shifts from finger-pointing to collaborative problem-solving.
The Cost of Getting It Wrong
The consequences are measurable:
40–60 hours per quarter rebuilding logic that should persist
15–20% forecast variance between projected and actual capacity
$200K–$500K revenue loss per unplanned departure
30–60 days before coverage gaps become visible
Zero continuity between cycles—teams start from scratch every time
Capacity gaps are not surprises, they are predictable. What’s missing is visibility.
The Path Forward: Proactive, Not Reactive
High-performing revenue teams identify capacity risks early and quantify them immediately. They unify data from HR, Finance, and Sales and operate from a single, continuously updated planning model.
They replace quarterly rebuilds with always-on capacity intelligence.
They stop explaining the impact of attrition after the fact—and begin adjusting for it before it hits the number.
From Explanations to Intelligence
When you:
Track ramped capacity instead of headcount
Quantify recovery timelines on day one of a departure
Use shared knowledge instead of individual spreadsheets
Unify HRIS, ATS, and CRM data into one planning system
Model scenarios before problems appear
You shift from reactive operations to proactive revenue intelligence.
Capacity gaps will happen. The question is whether you’ll detect them in time to change the outcome.
Ready to eliminate capacity blind spots before they impact quarterly results?
Steal This: The 7 Pitfalls Cheat Sheet
We condensed the biggest failure points in sales capacity planning into a printable operator cheat sheet. Use it to coach teams, stress-test models, or build alignment across Sales, Finance, and HR.